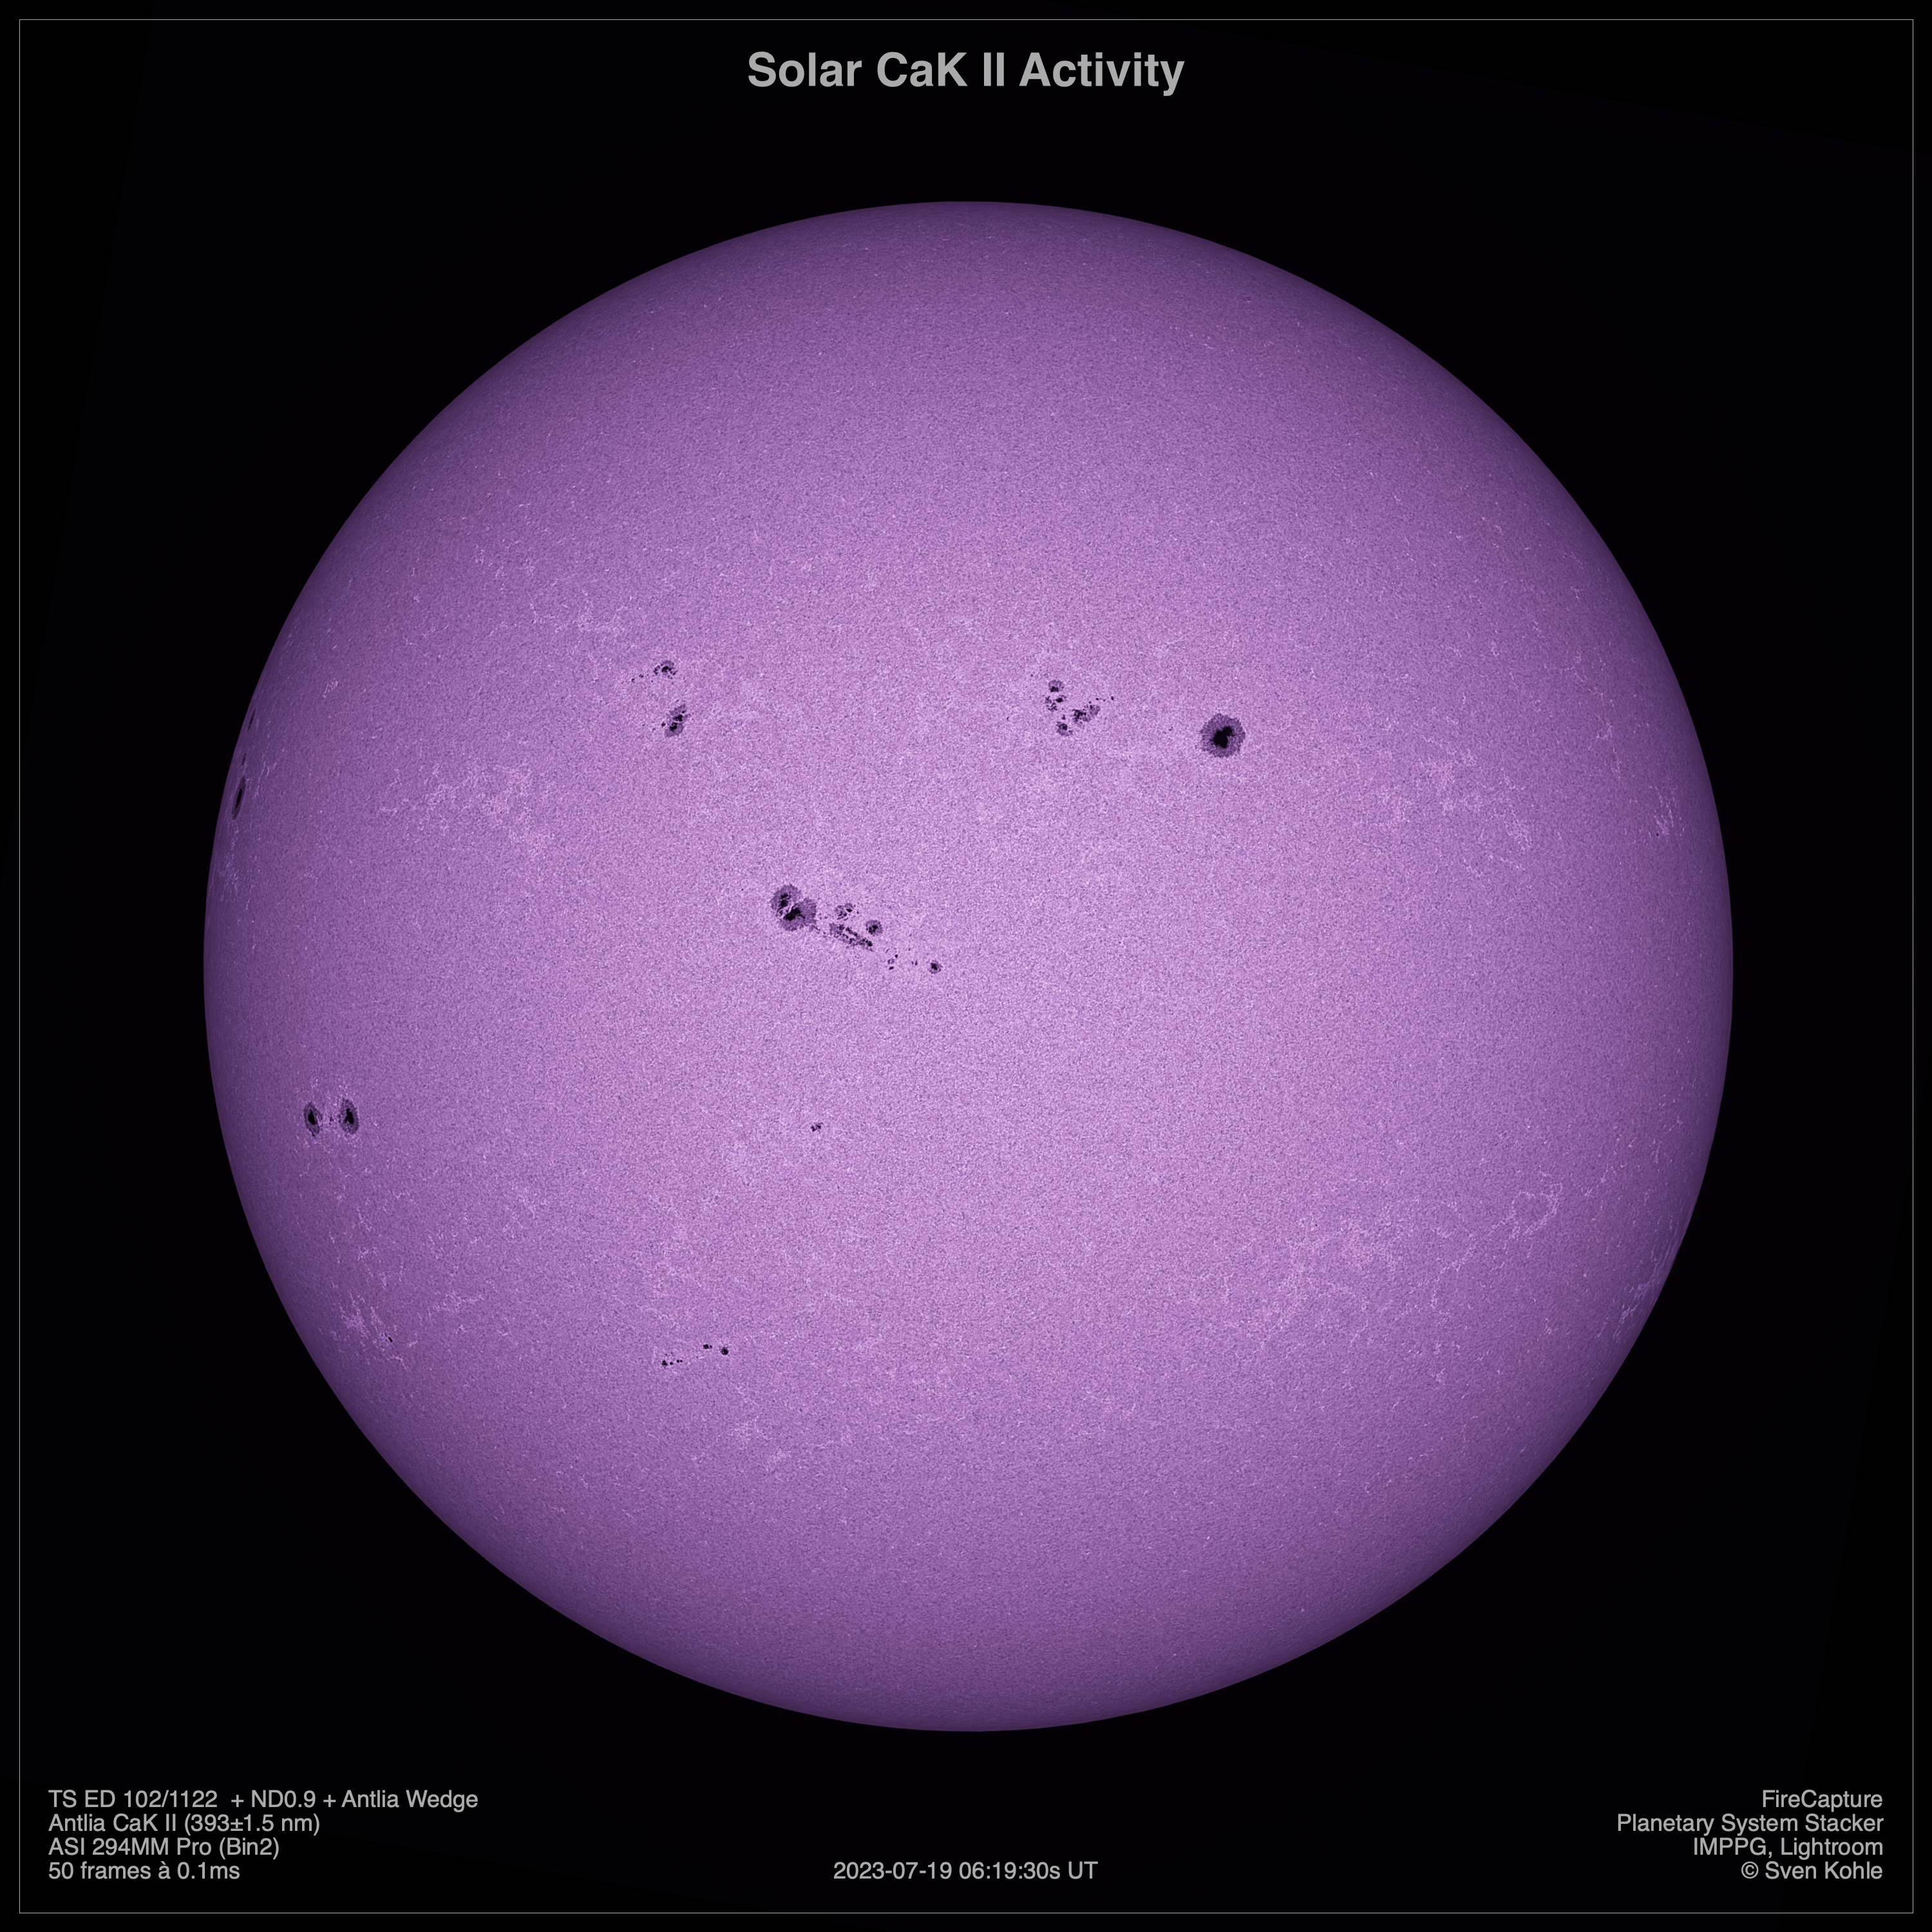
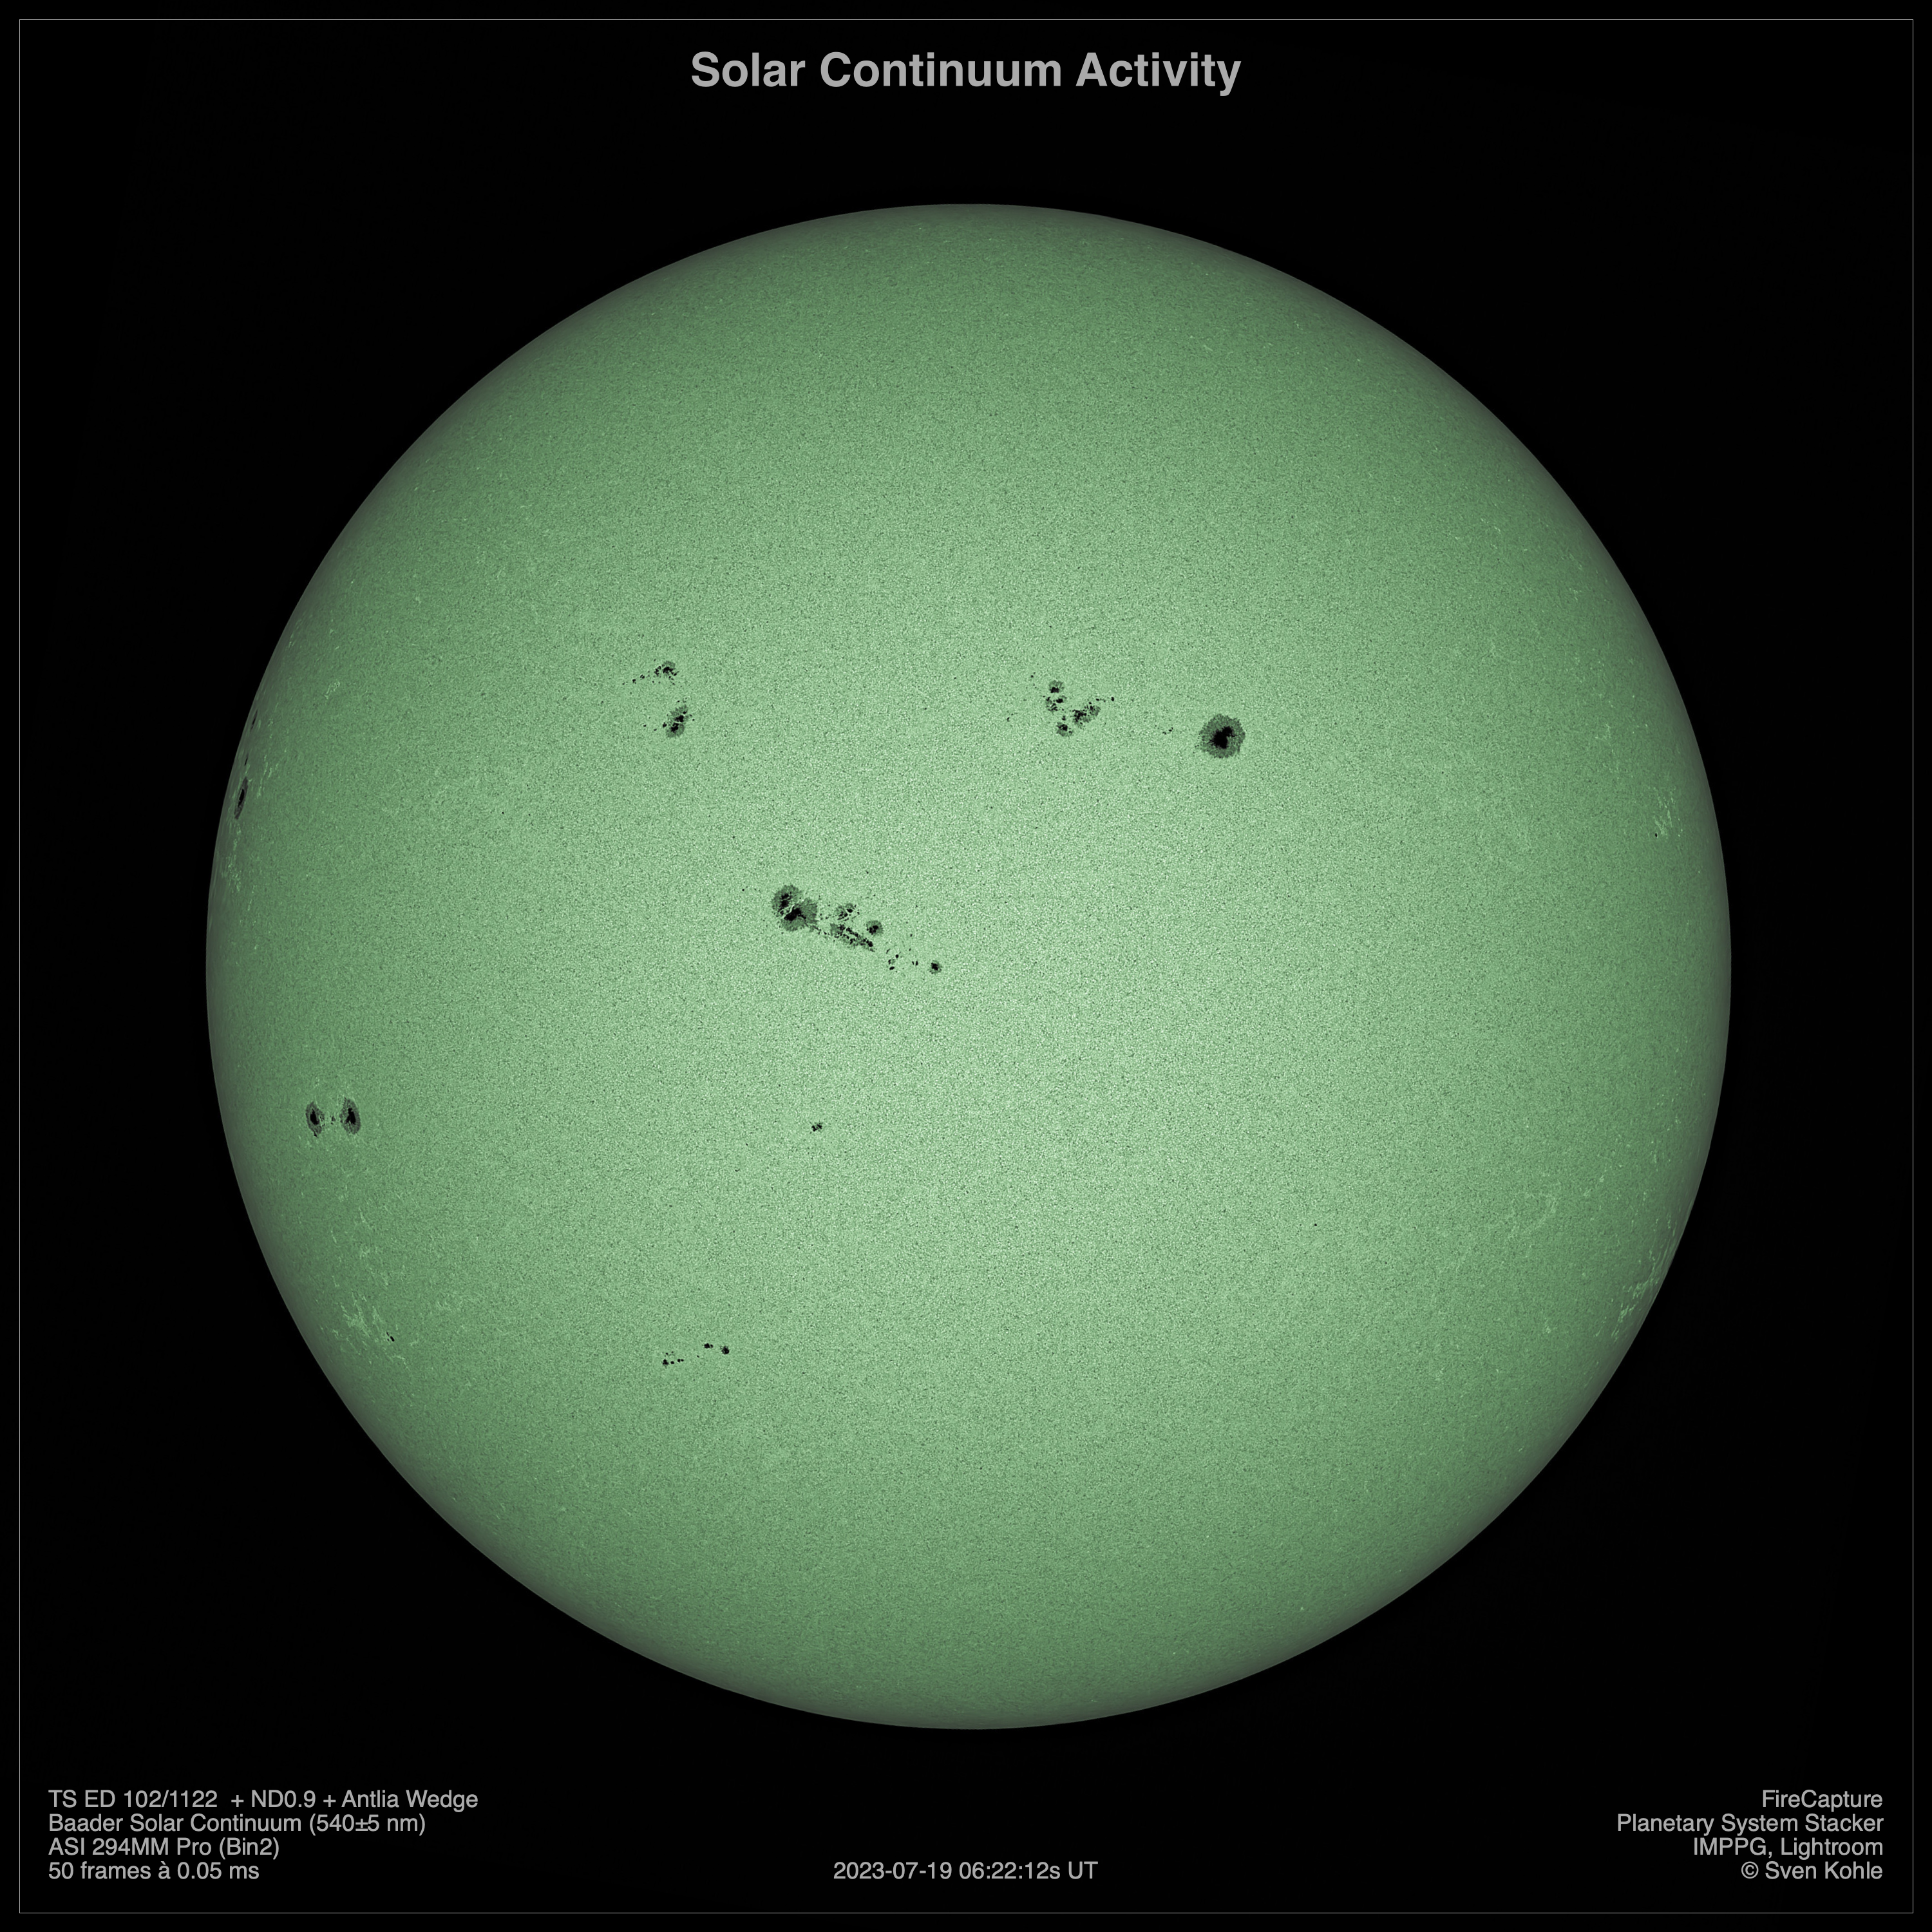
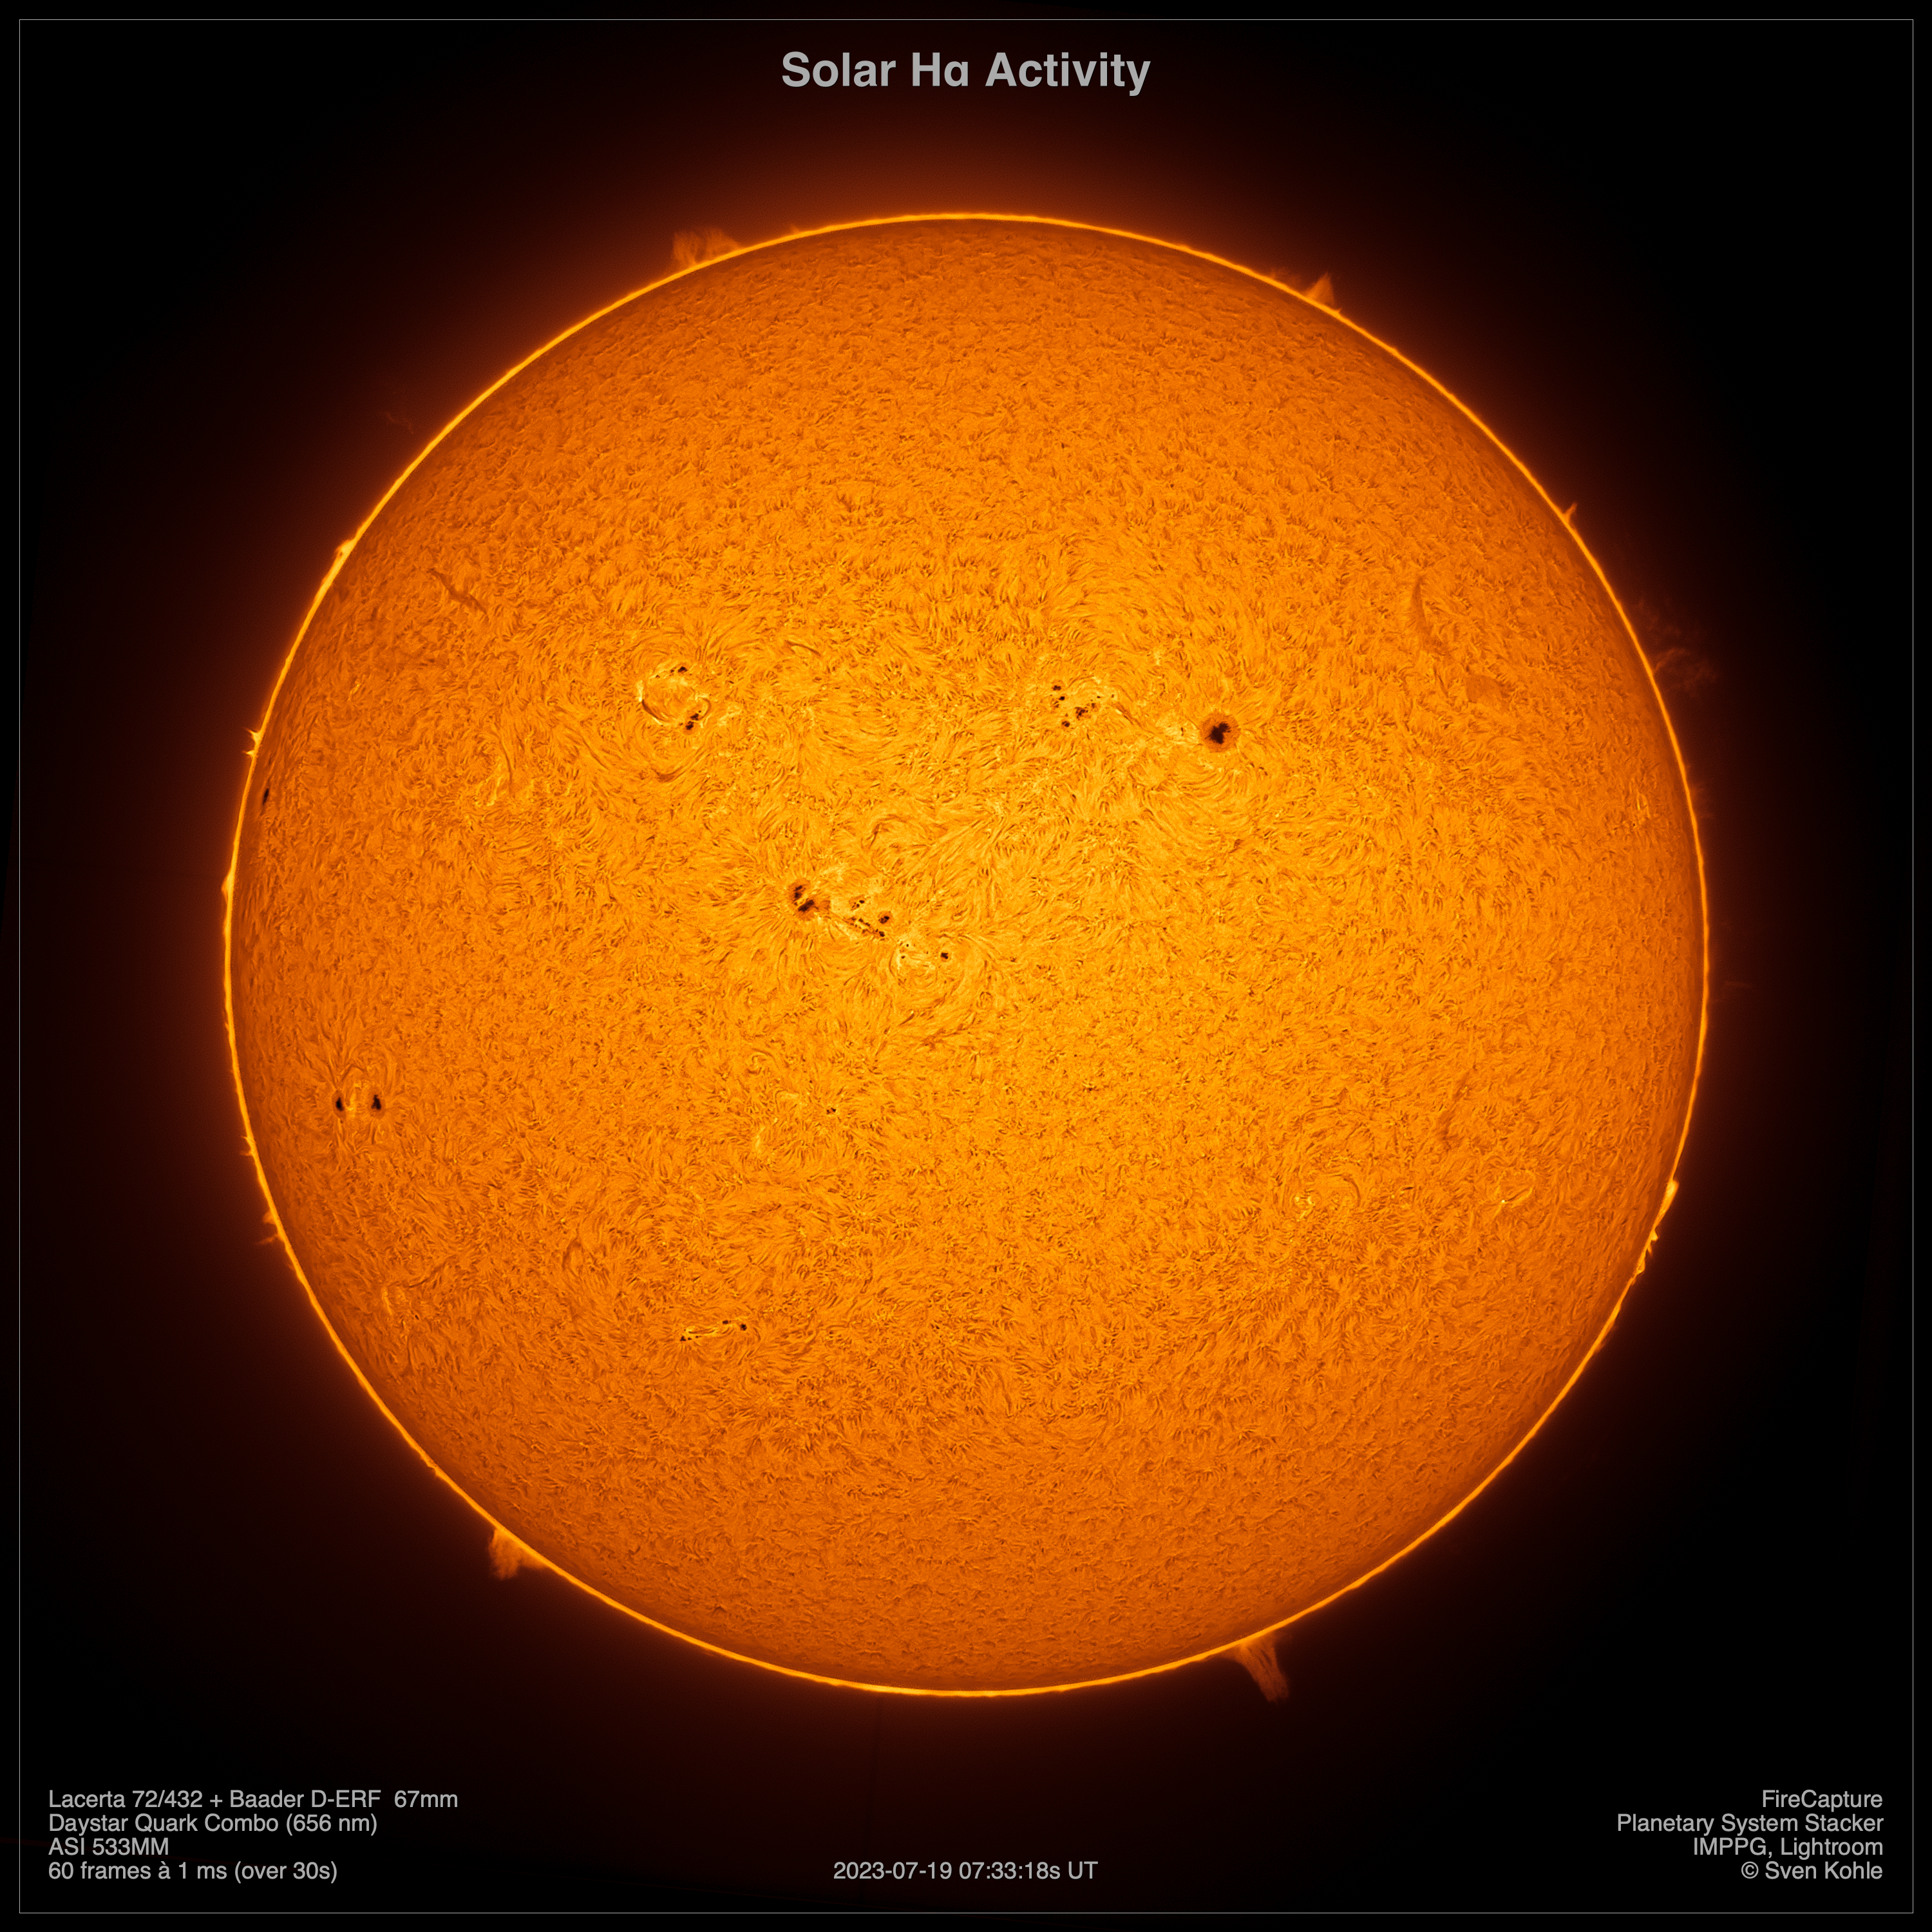
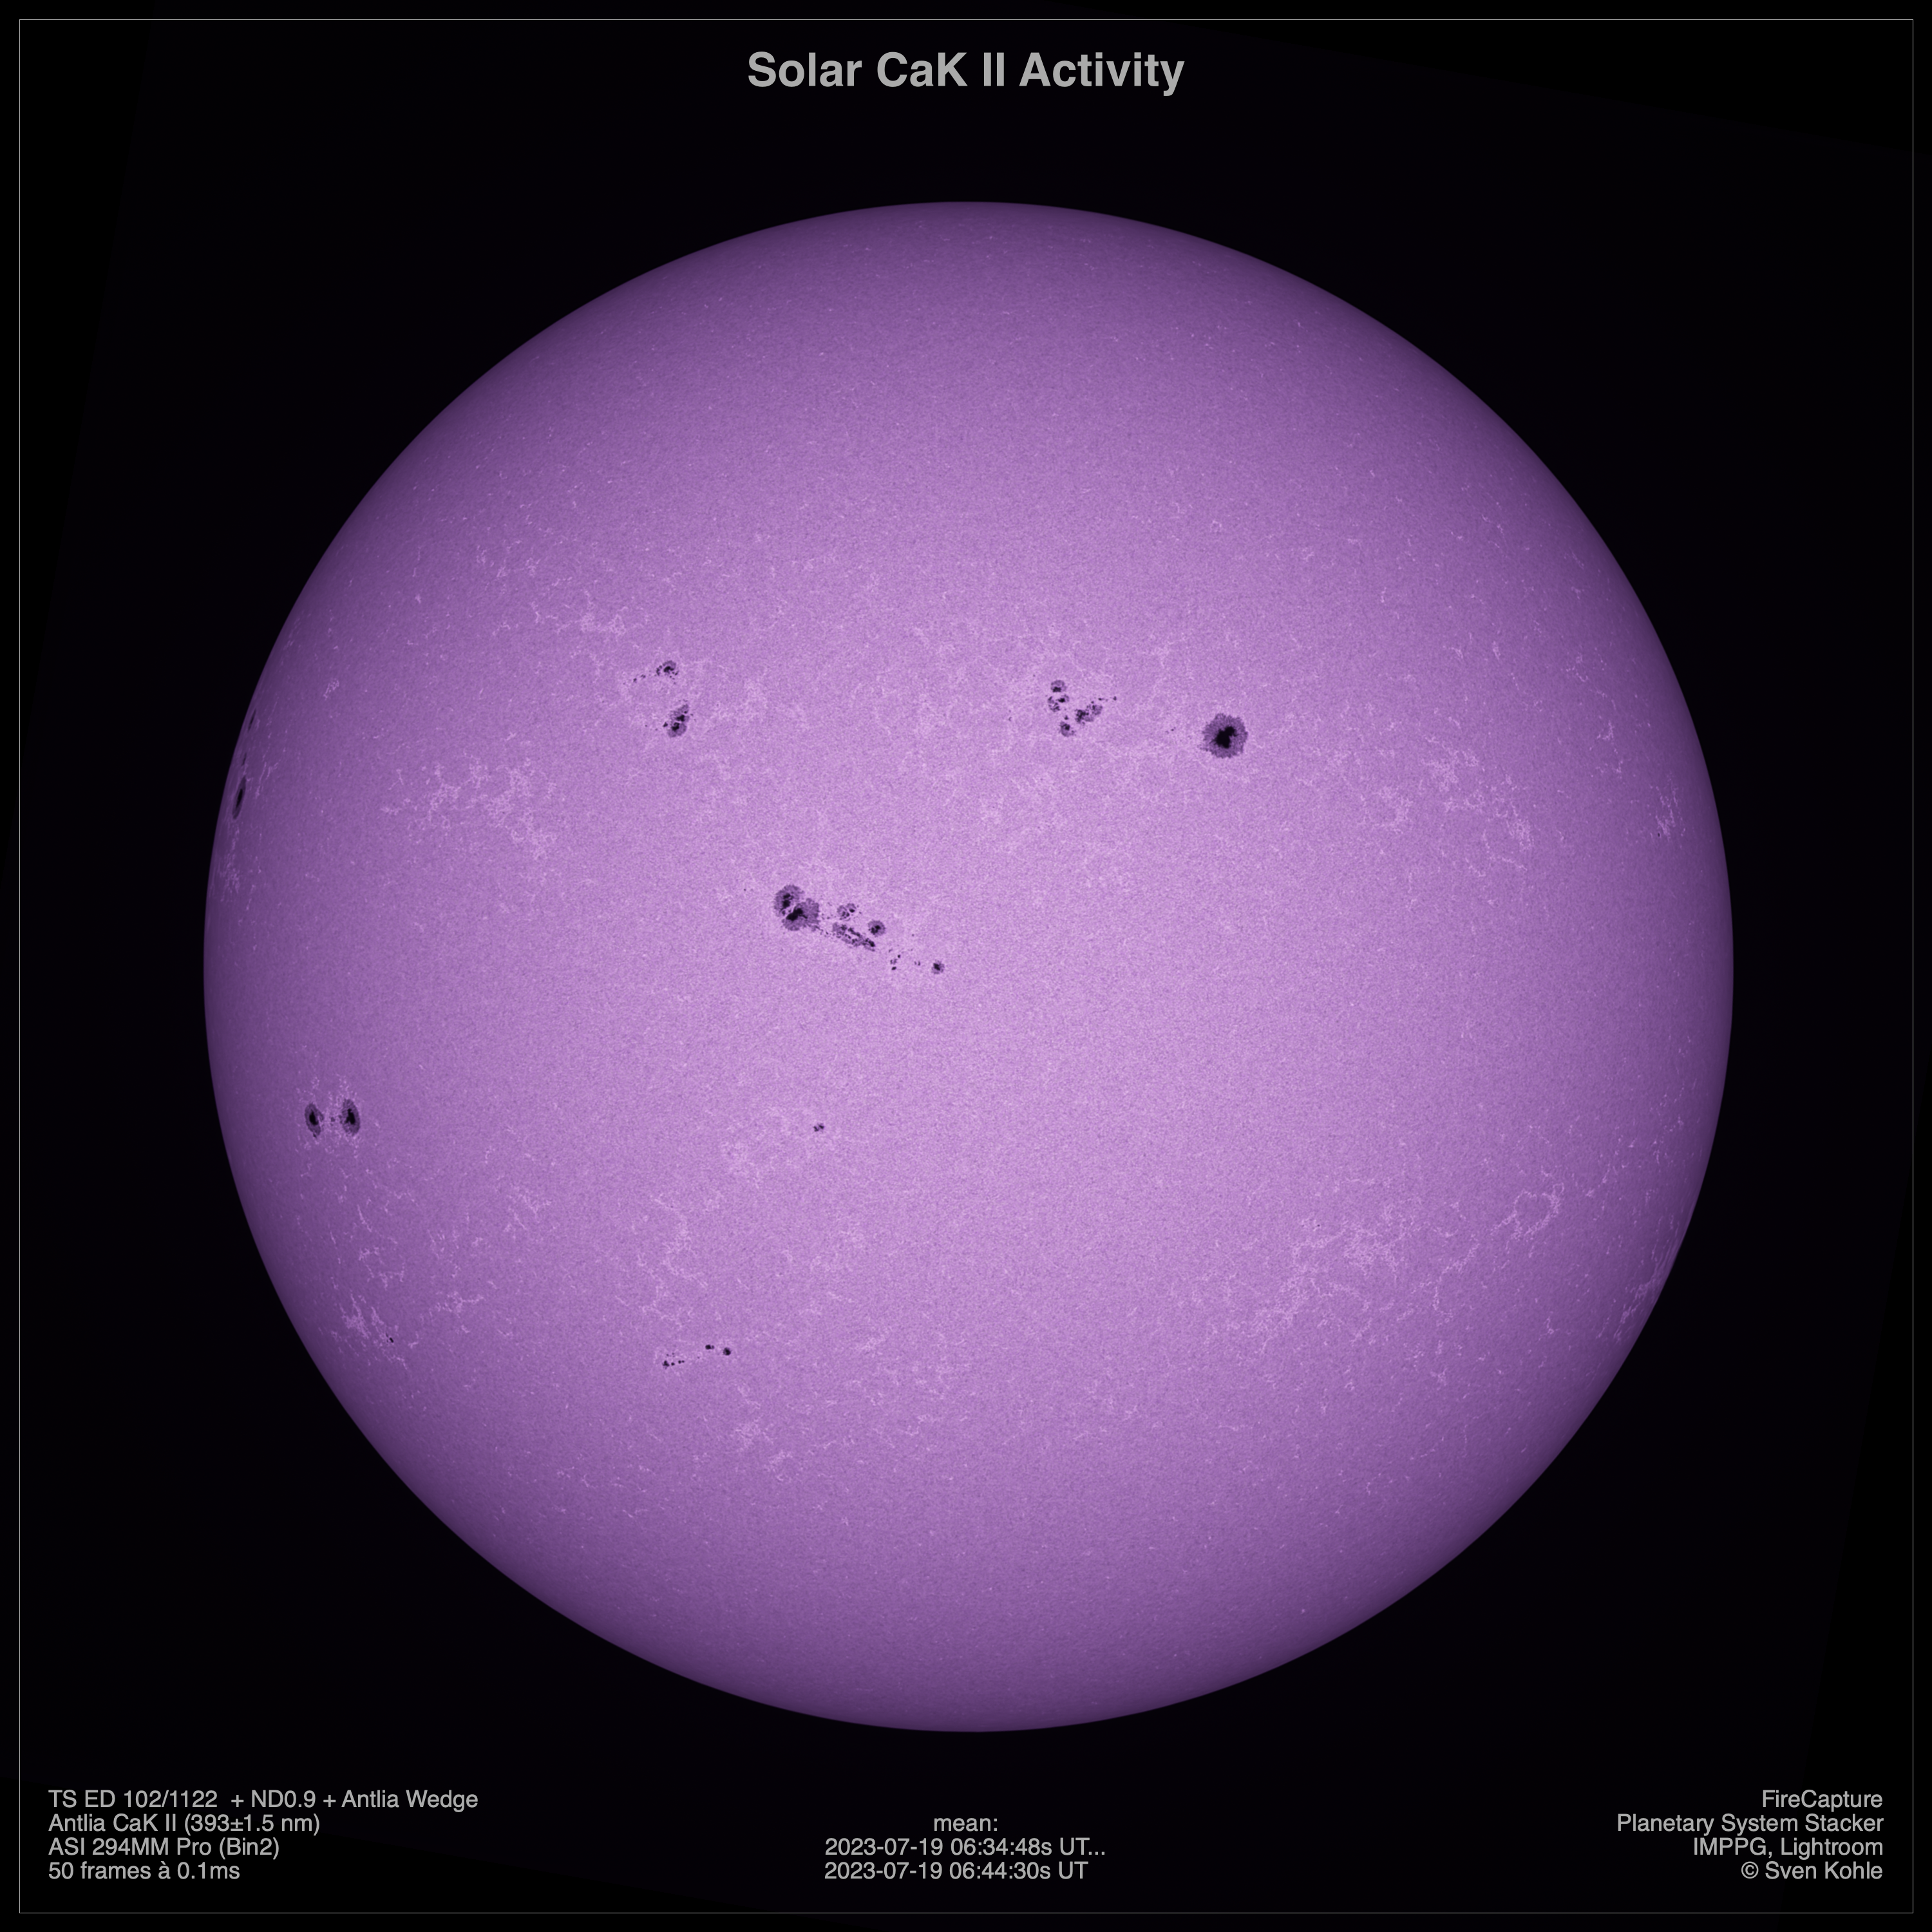
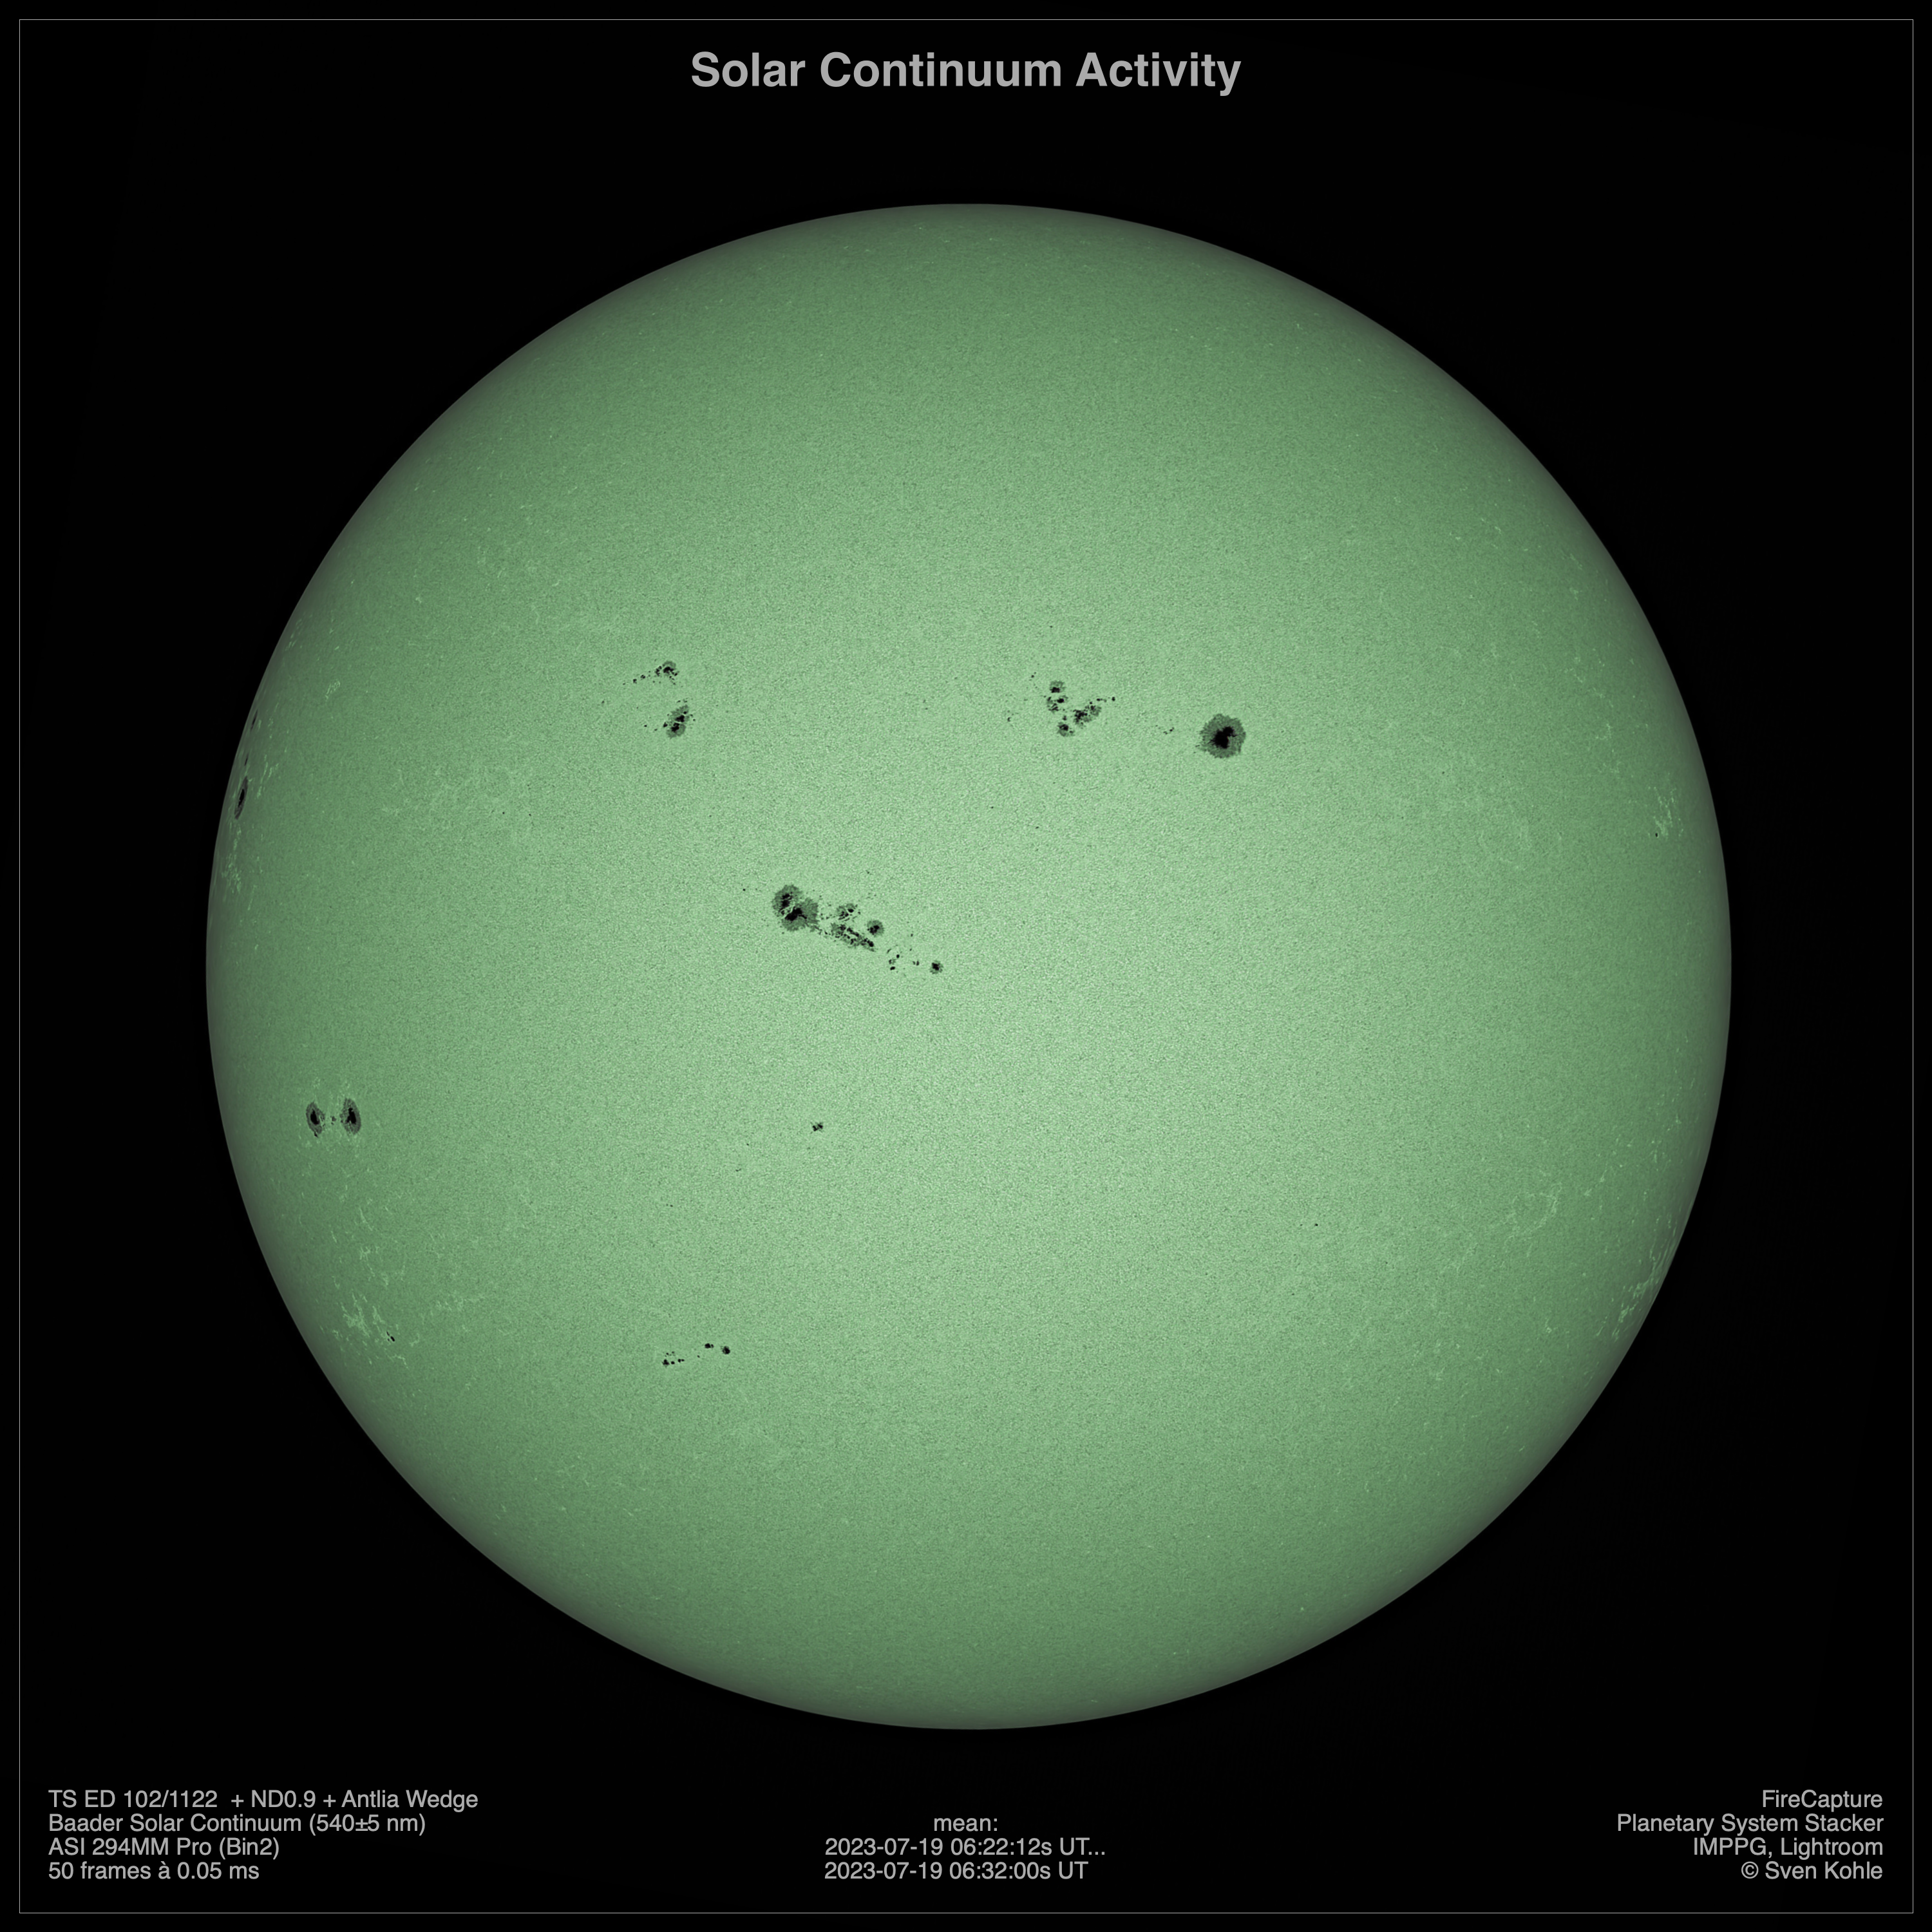
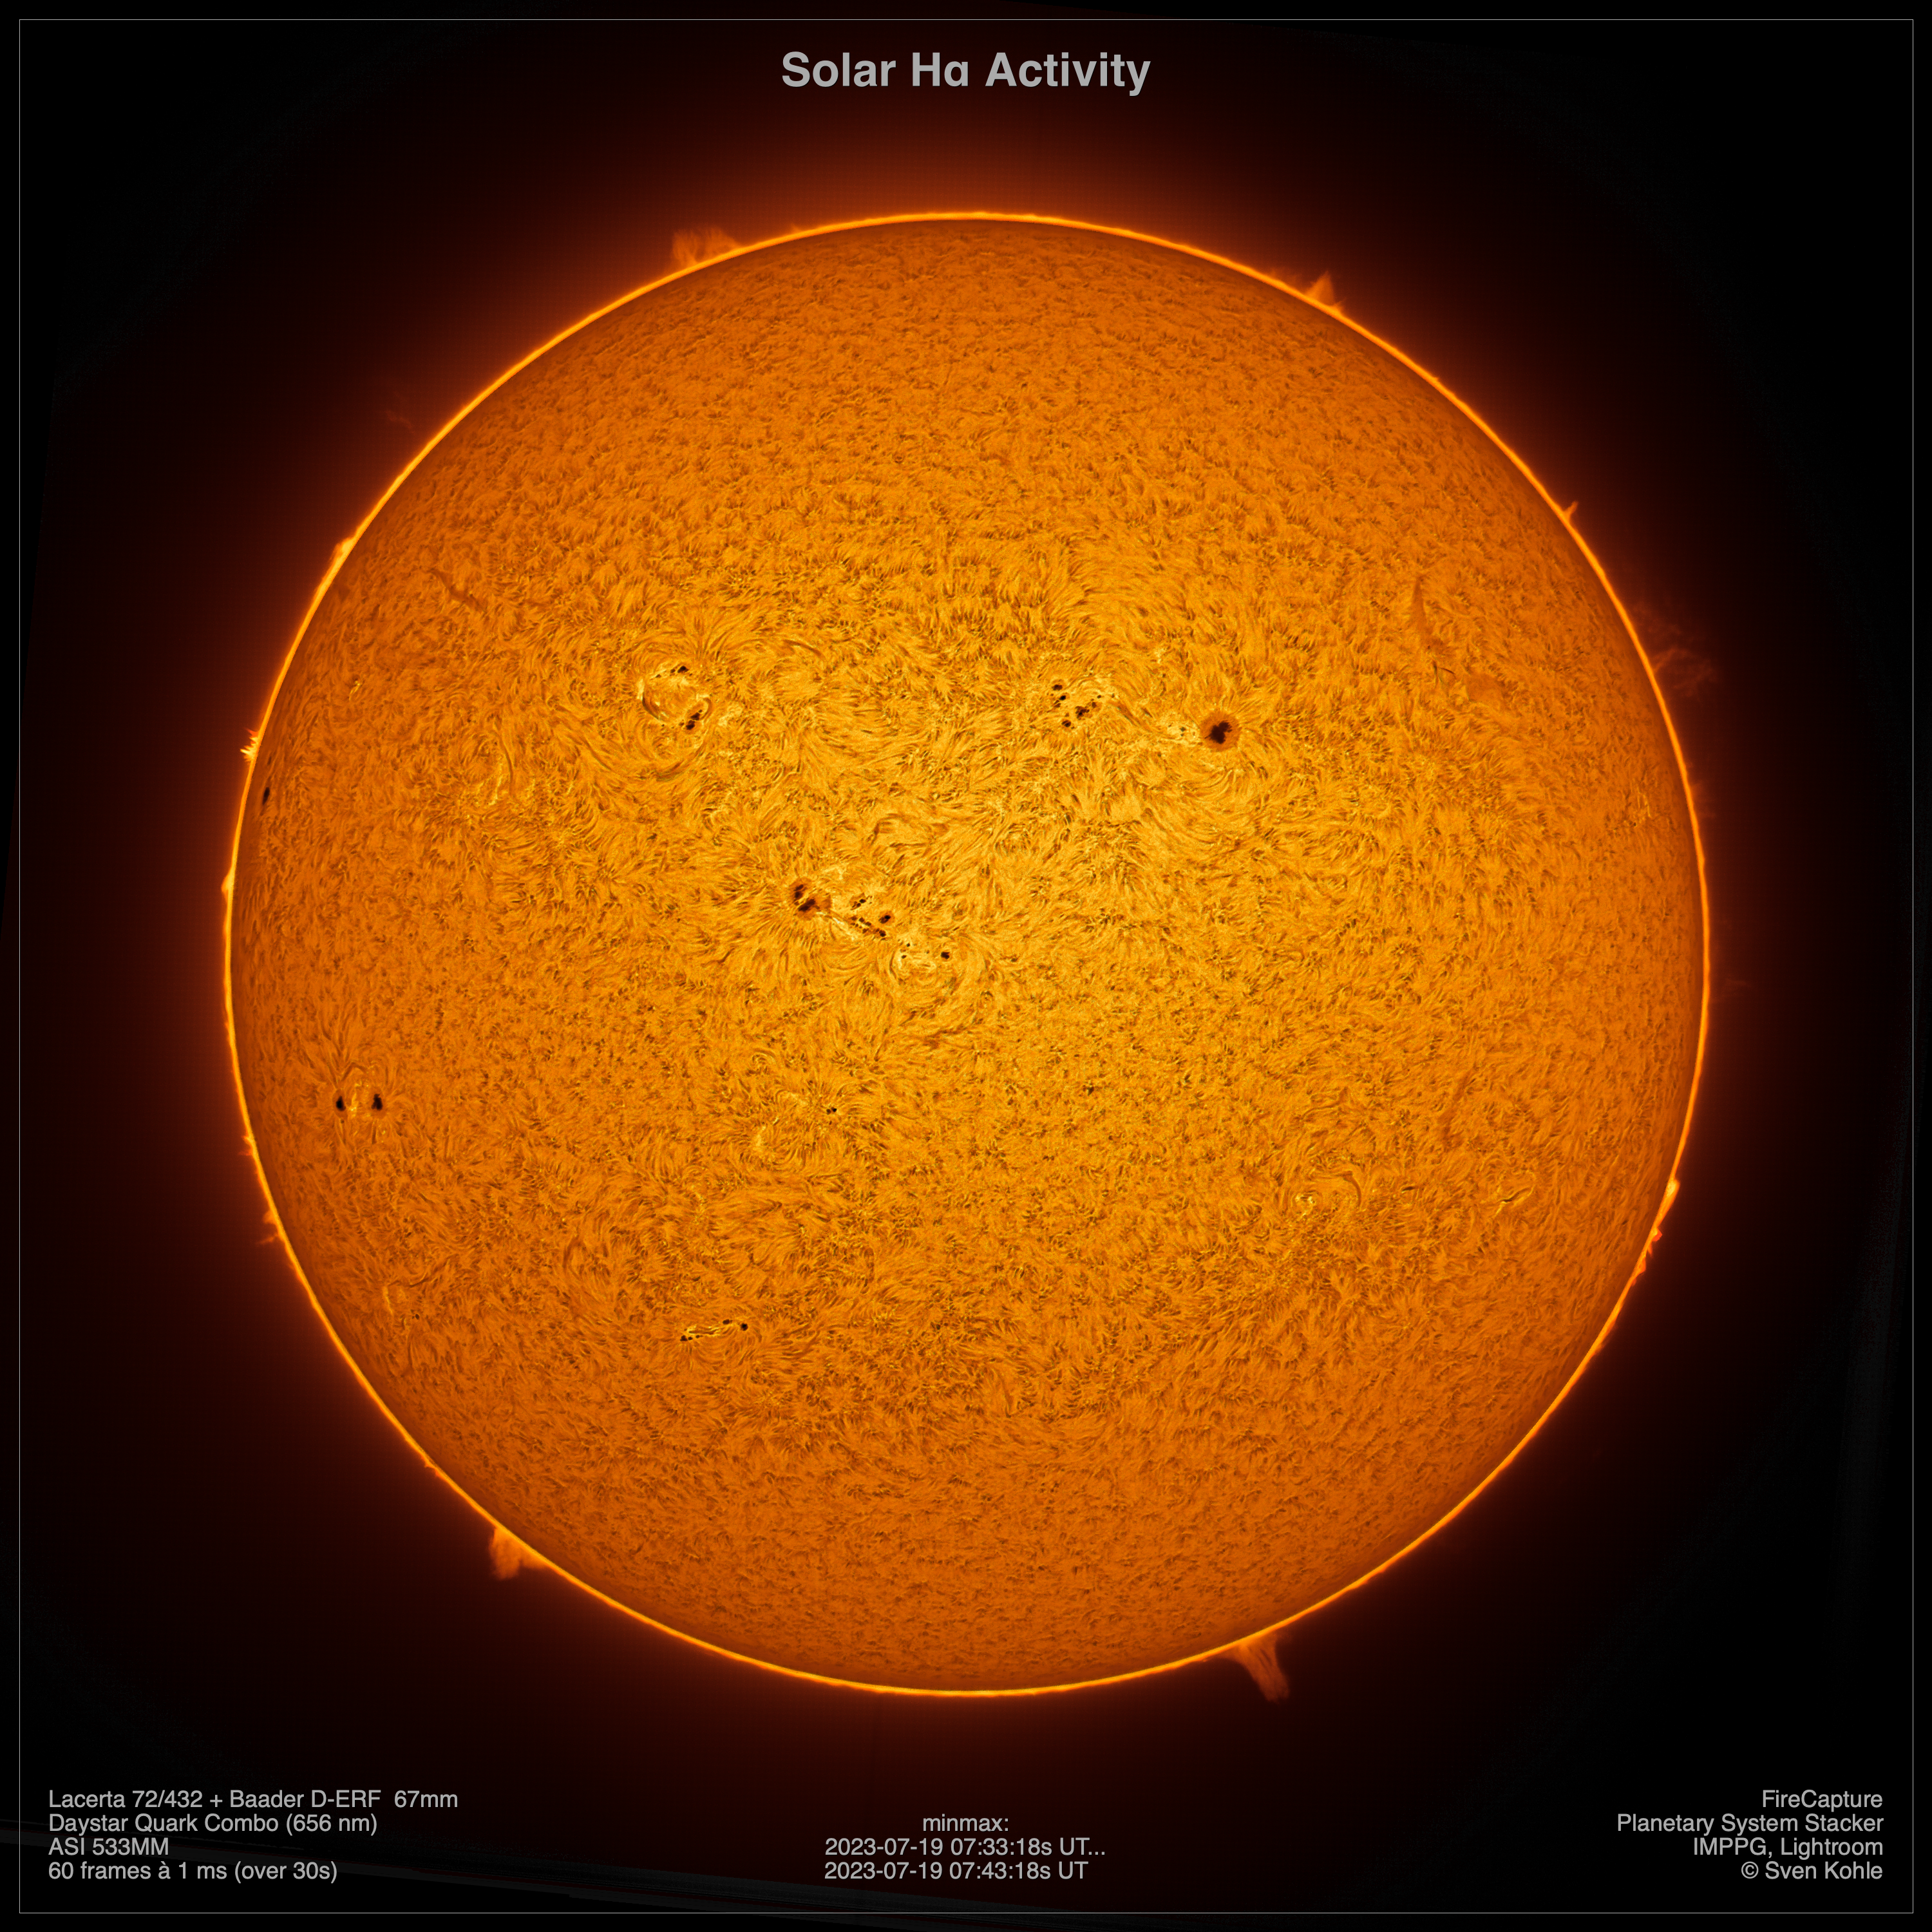
This animation blends two solar images acquired in the CaK continuum light in the near UV (purple) and in the visible green continuum light (green). The images were taken with just 2.5 apart from each other by using the same telescope. You can see slight differences in the appearance: stronger limb darkening in the short wavelength of the CaK continuum light and much better appearance of the bright faculae and plages in the transition area between photosphere and chromosphere. In the visible green continuum such faculae are only visible near the solar limb. This animation blends two solar images acquired in the CaK continuum light in the near UV (purple) and in the H-alpha line emission (orange). Whereas the CaK image was averaged over 10 minutes to better depict the bright plage, the H-alpha image was taken in-between. The H-alpha images shows the chromospheric fringe which makes the visible disk slightly larger than the photospheric disc shown in CaK. Inspection of the activity regions shows sometimes interesting correlations between plage regions and the spicules visible in H-alpha. As these spicules represent the projected magnetic field lines it seems that sometimes these are correlated and starting from the plage regions in the photosphere.This animation shows the temporal evolution of the CaK continuum emission over a period of 75 minutes. You can already see effect of the solar rotation. Only subtle variations of substructure in the various activity regions can be seen. The very fine granular structure is changing rapidly whereas the faculae, chromospheric network and sunspots are changing on a much longer time period. Hint: you can increase the playback speed of the video in the player-menu.This animation shows the temporal evolution of the H-alpha line emission over a period of 75 minutes. Much more prominent changes of solar activity regions are visible compared to CaK continuum. Beside solar rotation, there are many prominences (the bright structured erupting from the solar chromosphere) which change rapidly. The same holds true for the dark filaments seen as projected patterns in front of the solar disc. Have a closer look into the different activity regions, a lot of motion is ongoing in many areas! Hint: you can increase the playback speed of the video in the player-menu which sometimes help to detect moving filaments.